Splunk is a widely used tool for monitoring, analyzing, and searching large amounts of machine data. With vast capabilities, there is no wonder why it has become so popular amongst many companies. You can gather various types of data from remote endpoints to ingest into your Splunk instance. Splunk mainly relies on its universal forwarder to send data to the Splunk servers, though, not all systems can install a universal forwarder. This is where syslog comes in handy with Splunk. Syslog servers help centralize data from devices that can’t install a universal forwarder, such as a router, or firewall device. Then the syslog server can send all of its aggregated logs to the Splunk server. Splunk has many uses, and we’ll see how to set it up in the coming sections.
Configuring Splunk on the Ubuntu Master Node
To keep the environment as simple as possible, the Splunk server will be our Ubuntu Master node. Typically, you would not have Splunk on a server with other computational processes as Splunk is quite resource hungry as it is. However, for a small setup like this, there shouldn’t be much, if any, contention. In this lab build, Splunk is not integrated with any of the other products, although it could be. In this section, we’ll be covering how to setup Splunk on the Ubuntu Master VM, followed by the Universal Forwarder setup. See below on how to install Splunk on the Ubuntu Master VM:
1. Navigate to https://www.splunk.com/en_us/download/splunk-enterprise.html#tabs/linux and either create a Splunk account or sign in with an existing one.
2. After logging in, select .deb from the Linux tab

3. Click download from command line and copy the contents of the popup.

4. Sign into the Ubuntu Master VM and open a terminal window.
5. Install Splunk
Change Directory to Downloads
cd ~\DownloadsDownload Splunk package
sudo <copied_contents>
Install the downloaded file
sudo dpkg -i <downloaded_filename>
Start Splunk and accept the license agreement; Also input a username and password that will be used to login to Splunk
sudo /opt/splunk/bin/splunk start --accept-license --answer-yes
6. Login to the Splunk instance at http://[IP]:8000 replacing IP with your Ubuntu Master VM’s IP
7. Navigate to Settings > Receiving and Forwarding

8. Add receiving rule for 9997


Configuring the Windows Node
Now that the Splunk server is setup, we need to actually get data into Splunk. There are a few ways to do this, but to get continuous real time data that is actually useful, we will setup a Universal Forwarder on the Windows VM. Another way you could get data into Splunk quickly is from a file that you import manually. The universal forwarder installation is quite simple, especially if done from the command line as we will be doing. To install the Universal Forwarder, follow these steps:
1. Navigate to https://www.splunk.com/en_us/download/universal-forwarder.html and sign in if not already
2. Click 64-bit download for Windows (You may have to click "Try this URL" on the next page if the download doesn’t start automatically)

3. Open an Administrator Command Prompt or PowerShell
4. Install Splunk Universal Forwarder
Change the directory to where you downloaded the file
PowerShell: cd ~\Downloads
OR
Command Prompt: cd %userprofile%\Downloads
Run command to install the forwarder
NOTE: The IP address in the command as well as the Username and Password will need to be updated for your environment; the username and password does not have to be the same credentials as what you used for the administrator login to Splunk. The username and password entered here are used when running some Splunk cli commands on the Forwarder.
msiexec.exe /i splunkforwarder.msi AGREETOLICENSE=Yes DEPLOYMENT_SERVER=<ip>:8089 RECEIVING_INDEXER=<ip>:9997 WINEVENTLOG_APP_ENABLE=1 WINEVENTLOG_SEC_ENABLE=1 WINEVENTLOG_SYS_ENABLE=1 PERFMON=diskspace,network SPLUNKUSERNAME=<username> SPLUNKPASSWORD=<password> /quiet
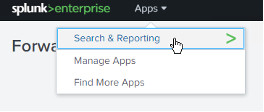
5. Go back to Splunk and open the search and reporting app

6. Do a search for index=* to verify data is coming in

Nearing the End
This series is almost over, and we’ve done so much already. If you’ve been following along with the lab builds so far, I hope you’ve been having fun doing so. Now that you have a general understanding of Splunk and how to retrieve log information from other machines, this can be greatly expanded with further configurations. Play around with different searches and create dashboard; the best way to get better at something is to use it.
In the next part, we’ll wrap up this series with Jira, you don’t want to miss it! :)

Comments